Tell us about the job
Takes about a minute. No obligation.
Sizing a heat pump for Custer County starts with the cold end of the heating season, not the mild shoulder weeks. Homes in Custer County, SD run heat about nine months a year, from September through May. As outdoor temperatures drop through those months, a heat pump loses capacity at the same time the house needs more of it. A contractor has to establish what the system must deliver on the coldest days before choosing equipment, because a unit that keeps up in October will fall short in January without backup heat staged behind it. Get that calculation wrong at installation and no amount of service work fixes the gap later.
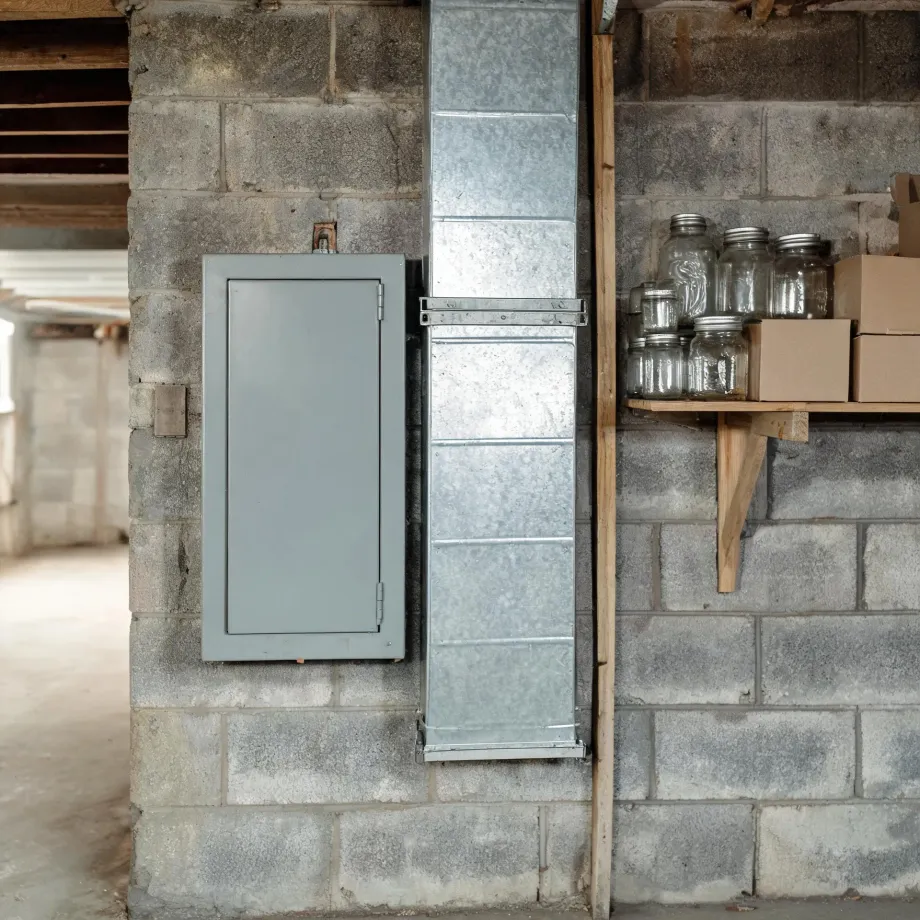
Ductwork and electrical panels in this county's housing stock were built around equipment that no longer runs in most of them. Half the homes in Custer County, South Dakota were built in 1994 or earlier (2020-2024 ACS 5-year). A heat pump pulls a different load than whatever the original system drew, and service panels from that era were not sized with that difference in mind. A contractor scoping an installation here checks the panel before pricing anything else, because the unit itself is the straightforward part of the job and the panel is where the job can change.
What Gets Installed With a New Heat Pump
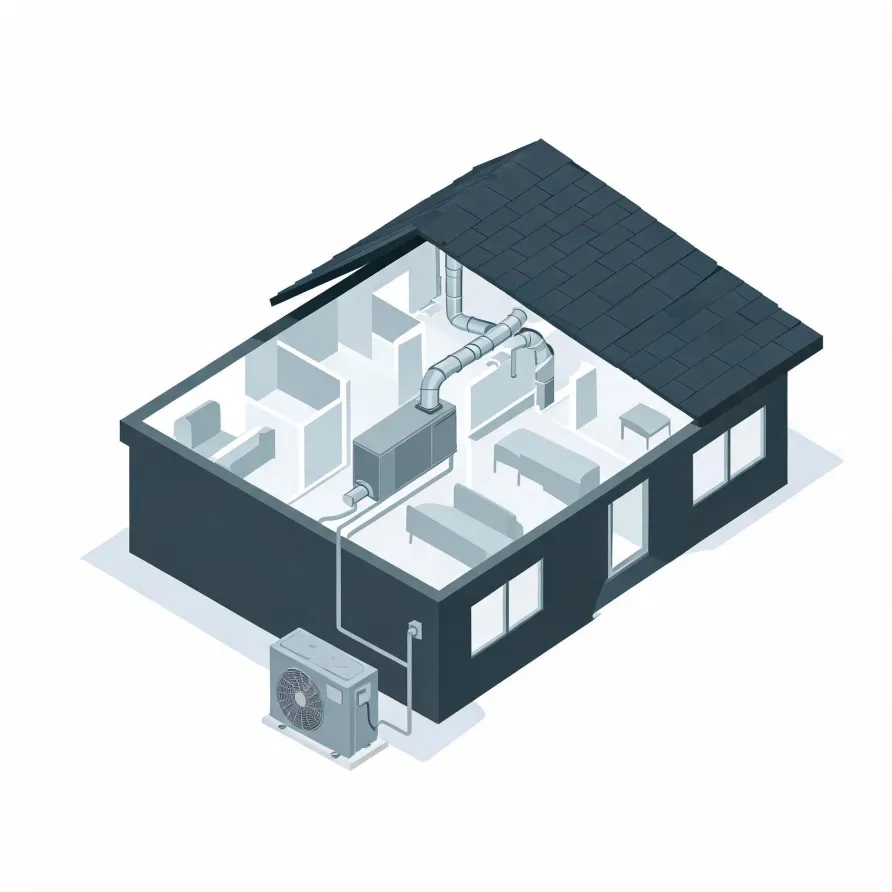
The outdoor unit is the piece most homeowners notice first. It sits on a pad beside the house and holds the compressor and the outdoor coil, which together do the core work of moving heat between outside air and the refrigerant running through the system. Inside, the air handler mounts in a utility space, attic, or closet and circulates conditioned air through the home.
A refrigerant line set runs between the two units, connecting the outdoor and indoor sides through the wall or the floor. A thermostat goes on an interior wall and gives the homeowner control over the system. Some installations also include an auxiliary or backup heat strip inside the air handler to cover the coldest days.
The drawing shows the general layout of a heat pump system, and a licensed contractor determines exactly what applies to this house.
Find a contractor in Custer CountyCuster County by the numbers
530 severe weather events were recorded in Custer County, South Dakota between 2015 and 2024.
NOAA National Centers for Environmental Information, Storm Events Database, bulk CSV export, events 2015-01-01 through 2024-12-31.Half the homes in Custer County, South Dakota were built in 1994 or earlier (2020-2024 ACS 5-year).
U.S. Census Bureau, 2020-2024 American Community Survey 5-Year EstimatesCuster County, South Dakota holds 5,291 housing units (2020-2024 ACS 5-year).
U.S. Census Bureau, 2020-2024 American Community Survey 5-Year EstimatesOwners occupy 85.6% of the occupied homes in Custer County, South Dakota (2020-2024 ACS 5-year).
U.S. Census Bureau, 2020-2024 American Community Survey 5-Year EstimatesSevere Weather Events in Custer County
Custer County's weather puts real demands on heating and cooling equipment, and those demands shape what a heat pump here needs to handle over its life. A system sized and installed for local conditions holds up differently than one built to a generic spec.
530 severe weather events, 2015–2024. Source: NOAA National Centers for Environmental Information, Storm Events Database.